How to use
1. Running a simulation
Once you've setup your project, you can now run your simulations.
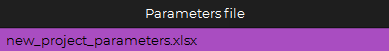
To start, choose your parameters file in the parameters selector:
Next, choose the duration (hours) and the time step (hours) of the simulation.
Tip
It is recommened to use small time steps to capture the small changes in the system and have more accurate results.
Advanced options
Clicking on the Advanced options button will make them appear:
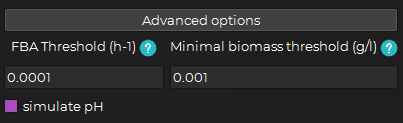
You can then change:
-
The fba threshold (h-1) : The threshold above which the optimal solution of FBA should be for the organism to be considered as growing. (default is 0.0001 h-1) (E.g. if the optimal solution of FBA is 0.00001 h-1 and the fba threshold is 0.0001 h-1, the organism will be considered as not growing)
-
The minimum biomass threshold (h-1) : The value to which the biomass concentration is rounded when it goes below the threshold. (default is 0.001 h-1) (E.g. if the biomass concentration is 0.0001 and the minimum biomass threshold is 0.001, the biomass concentration will be rounded to 0.001)
You can also check the simulate pH. (By default, this option is unchecked)
-> Checking this option will add the pH tab to the interface and will simulate the pH of the system during the simulation.
Analysis type
The Analysis type option allows to choose between dynpop_analysis, ko_analysis or batch_analysis:
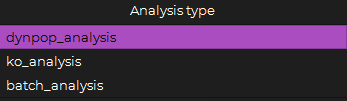
dynpop_analysis : The default selected type representing the regular simulation.
ko_analysis : Used to run the simulation without any knockout (wild type) then run it with each gene knockout individually and compare the results.
batch_analysis : Used to run the simulation with multiple parameters files at once.
To use this option, you have to select the batch folder containing the parameters files you want to run the simulation with.
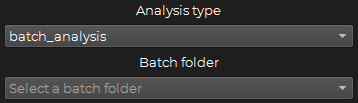 The folder needs to be inside the data/batch folder.
Now, you can start your simulation by clicking on the Start simulation button:

Info
If there are any problems with your files, the application should show useful messages to fix them.
2. Stopping a simulation
During the simulation, the Stop simulation button (previously grayed out) will become active (red):
You can click on it at any point during the simulation to stop the simulation at the current time and display the results.
3. Continuing a simulation
Once the simulation is finished (or stopped), a continue simulation with same parameters button should appear with an Added duration (hours) input.

You can now choose the desired added duration and click on the continue simulation with same parameters button.
4. Starting a new simulation
If you want to start a completely new simulation, you can click on the New simulation button  at the top tool bar then start fresh with step 1.
Warning
This will reset the interface including the input bar and the result figures so make sure to save the previous simulation results first.
5. Finding the limiting substrate(s)
Once you ran a simulation, you can find the limiting substrate(s) by clicking on the Find limiting substrate(s) button:

Info
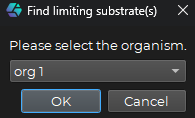
If there are multiple organisms in the simulation, you will be prompted to choose the organism you want to find the limiting substrate(s) for.
This feature will find the last time point where the chosen organism stopped growing and find the metabolite(s) that are limiting the growth of the organism starting from that time point.
Once the process is finished, the limiting substrate(s) will be displayed in a pop-up window where you can see the metabolite(s) with the corresponding new growth rate after one new time step, with the tested metabolite(s) concentration set to 1000 mM like this:
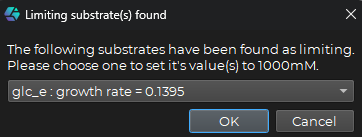
Once a limiting substrate combination is selected you can click on the OK button to set the concentrations of the chosen metabolite(s) to 1000 mM.
You can then either search for the next limiting substrate(s) again to try to increase the growth rate further or continue the simulation with the new concentrations.
6. Exploring results
Once the simulation is finished (or stopped), you can start exploring the results.
6.1. Biomass results
The biomass results should already be drawn on the corresponding canvas.
6.2. Volume results
The volume results should already be drawn on the corresponding canvas.
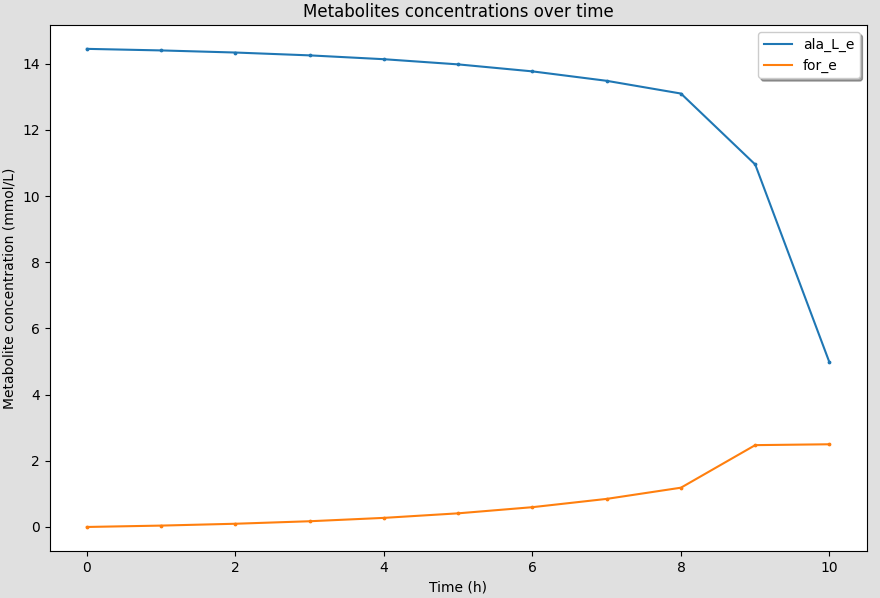
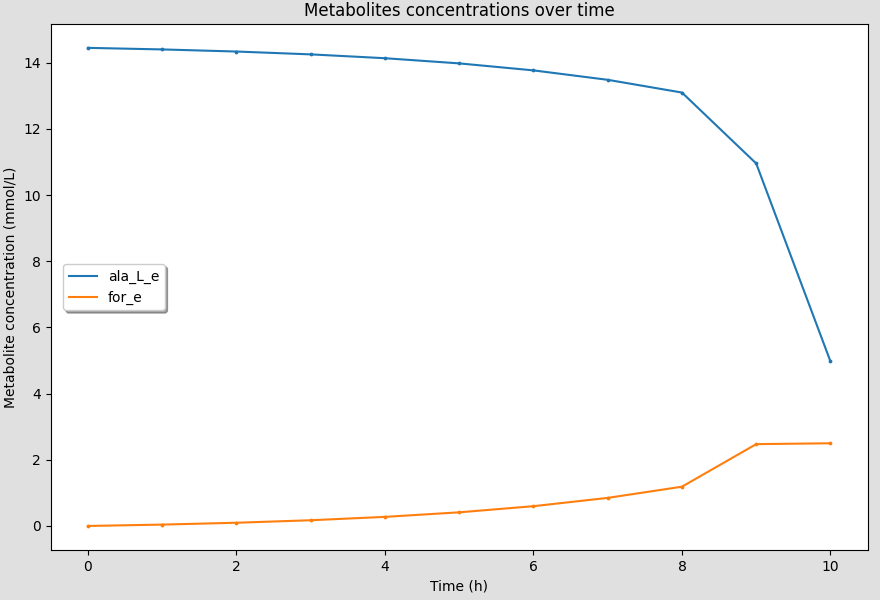
6.3. Metabolites results
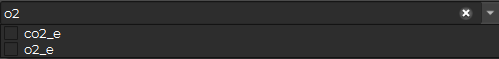
For the metabolites, you have to choose the metabolites you want to display.
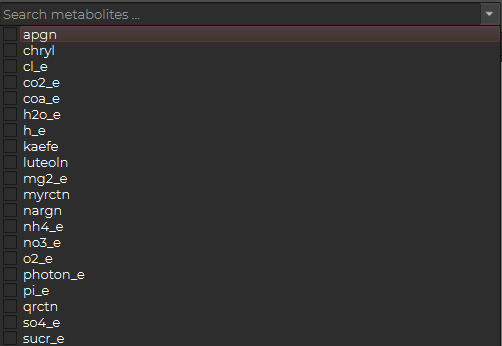
You can either click the down arrow to see the list or type in the search bar for fast access:
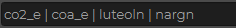
While you're selecting the metabolites they should appear on the bar above the selector like this:
You can unselect all of the selected metabolites at once just by clicking on the Clear metabolites button:
Once all the desired metabolites are selected you can display the metabolite results figure by clicking on the Display metabolites button:

Info
If you continue the simulation with the same parameters, the metabolites results will be updated with the new results.
6.4. Fluxes results
For the fluxes, you have to first choose the organism you want to display the fluxes for.
Info
If you are using a single model for your simulation this is automatically selected.
Next, you have to choose the desired fluxes to display of the chosen organism:
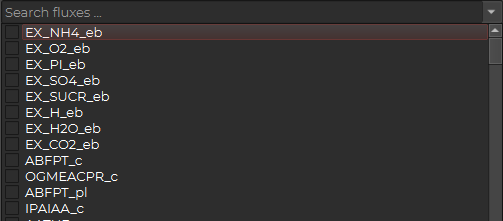
You can either click the down arrow to see the list or type in the search bar for fast access:
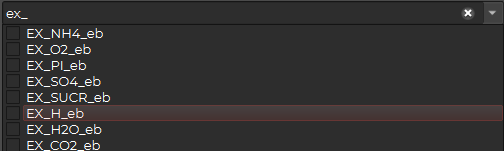
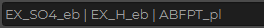
While you're selecting the fluxes they should appear on the bar above the selector like this:
You can unselect all of the selected fluxes at once just by clicking on the Clear fluxes button:
Once all the desired fluxes are selected you can display the fluxes results figure by clicking on the Display fluxes button:

Info
If you continue the simulation with the same parameters, the fluxes results will be updated with the new results.
6.5. Display exact values on hover
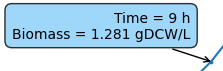
You can see the exact values of the curves by hovering over the time points on the canvas to have a quick look at the values.
The values should appear in a pop-up like this:
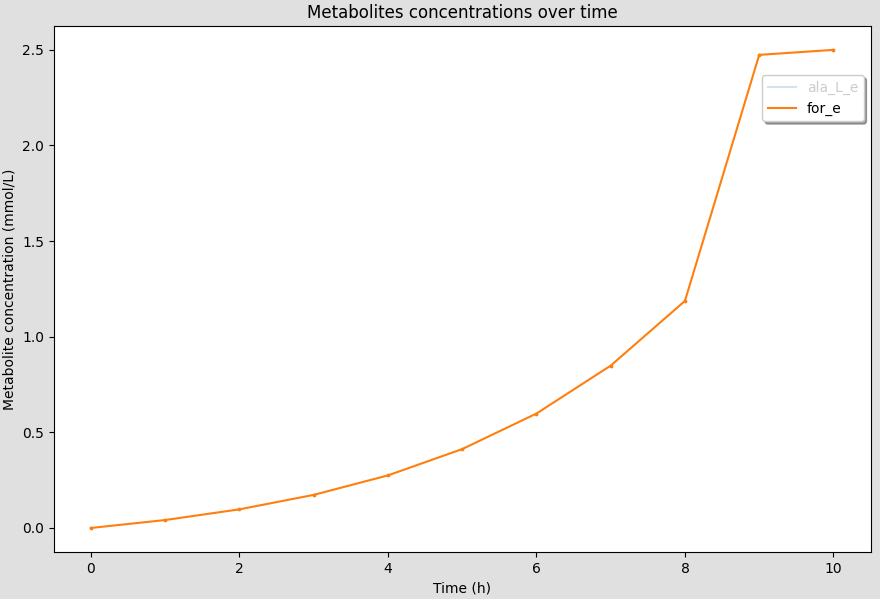
6.6. Showing/hiding curves
You can show/hide the curves by clicking on the legend of the curves on the canvas.
The curves should disappear/appear when you click on the legend.
The axis limits will be automatically adjusted to the new curves displayed.
6.7. Customizing figures
Each canvas has a toolbar that allows you to customize the figure: 
6.7.1. Zooming
By selecting the Zoom button  you can zoom in by clicking and drawing a rectangle on the canvas.
6.7.2. Dragging
By selecting the Drag button  you can move the figure around by clicking and dragging on the canvas.
6.7.3. Customizing dimensions, shapes, colors and labels
By selecting the Customize button  you can customize the shapes and colors of the figure as well as the title and the axis labels.
The following window should appear with the Axes tab selected by default:
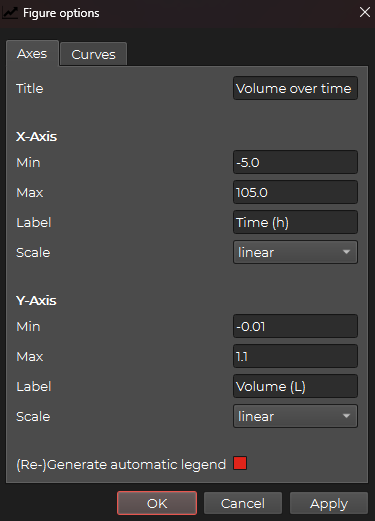
Here you can change the title and the axis labels as well as the dimensions of the figure and the scale of the axes.
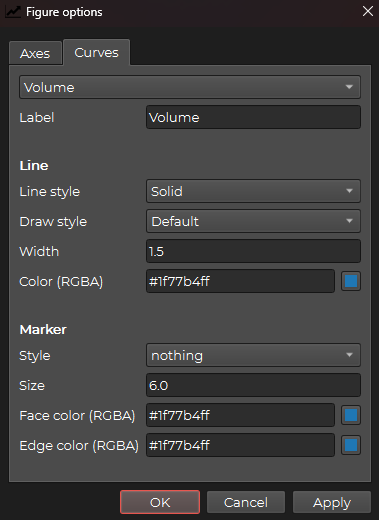
Or you can go to the Curves tab to change the shapes, colors and labels of the curves:
6.7.4. Changing layout
By selecting the Layout button  you can change the layout of the figure.
The following window should appear:
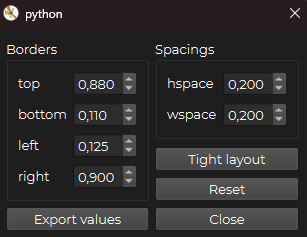
You can choose the tight layout option to make the figure fit the canvas and become more readable or reset the layout to the default layout.
6.7.5. Resetting
By selecting the Reset button  you can reset the figure to its original state.
6.7.6. Saving
By selecting the Save button  you can save the figure as a png image.
You will be prompted to choose the folder where you want to save the figure and the name of the figure file.
6.7.7. Open graph data in table format
By selecting the Open graph data button  you can open the data of the figure in a table format.
The following window should appear:
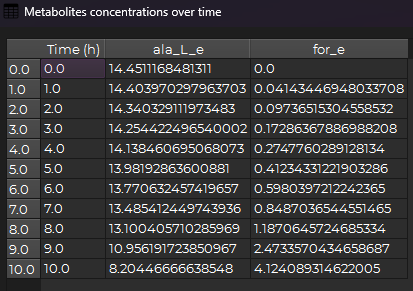
You can then see the raw data of the figure and copy, paste values.
6.7.8. Dragging the legend
You can also drag the legend of the figure by clicking and dragging it around the canvas.
This is useful when you have multiple curves and the legend is blocking the view of the curves.
7. Saving results
Once you're done exploring the results, you can save them by clicking on the Save results button:

You will be prompted to choose the folder where you want to save the results and the name of the results file. Once you're done, click on Save and the results will be saved in the chosen folder.
8. Uploading results
You can upload one or more results files by going to:
Upload -> results file(s)
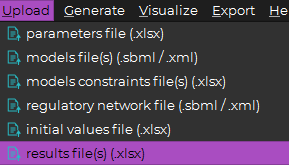
Then you can choose the results file(s) you want to upload and click on Open.
9. Visualizing and comparing results from uploaded files
Once the results file(s) are uploaded, you can visualize the results by going to:
Visualize -> results file(s)
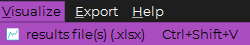
Then you can choose the results file(s) you want to visualize and click on Visualize.
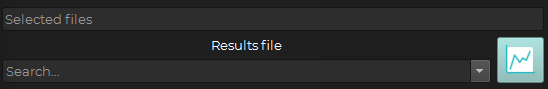
The results will be displayed just like the end of a simulation.
Choosing multiple results files will allow you to compare the results of the different simulations.
10. Generating parameters file from results
You can also generate a new parameters file from the results by clicking on the Save parameters file button:
What this will do, is generate a new parameters file by copying the initial parameters file used for the simulation. Then it will replace the initial concentrations of biomass and metabolites with the latest concentrations from the results for the next simulation you want to run.
11. Modifying uploaded files
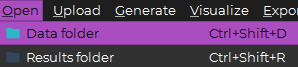
If you want to modify the parameters file or any other uploaded file, you can open the data folder by going to:
Open -> data folder
Warning
Please do not modify the folder structure in any way as it may cause problems with the application.
12. Exporting simulation files
This feature is useful when you want to share the simulation files with someone else or if you want to run the simulation on another computer.
If you want to export the simulation files, you can go to Export -> Export ssimulation files:
Then you can choose the parameters file related to the simulation you want to export and click on Open.
Now choose the folder where you want to save the simulation files and click on Save.
13. Toggle notification sound
You can toggle the notification sound for simulation end/error by clicking on the Toggle notification sound button: 